Metrics
Search performance and business metrics for MXP — track search quality, conversion, revenue, and trending behavior across your catalog.
What it solves
Search is invisible until something goes wrong. A query that returns no results. A high-traffic product that nobody clicks on. A trending category that the catalog isn't serving well. Without visibility into how search is performing, these problems go unnoticed — and revenue walks out the door with them.
MXP Metrics brings search performance into view across four dimensions: how shoppers are searching, how results are converting, which products are driving revenue, and what's trending before it shows up in your analytics dashboards. It gives merchandisers and search operators the data they need to act — not just observe.
When to use it
- Daily search health check — verify zero-result rate is low and conversion funnel rates are stable
- Investigating a drop in revenue or conversion — find which queries or products are underperforming and why
- Identifying gaps for enrichment or merchandising rules — high-traffic queries with low view rates signal result quality problems; high-view, low-purchase products signal pricing or content issues
- Catching trends before they peak — trending queries and categories surface emerging shopper intent so you can act before demand outpaces your catalog's ability to serve it
- Evaluating the impact of a change — after updating merchandising rules, enrichment configuration, or linguistic overrides, check whether the relevant metrics improved
Key concepts
Search count — the total number of searches executed in the selected time period, measured as sessions. For example, if one user makes multiple requests for the same query within a single session (e.g., with and without a vehicle filter applied), it counts as 1. The baseline metric for search activity.
Zero-result rate — the percentage of sessions that returned no products. A zero-result search is a complete failure of the search experience — the shopper saw nothing and likely left.
View rate — the percentage of sessions when the shopper clicked on at least one product. Generally measures result relevance, but improving search quality can occasionally decrease view rate — for example, a better search that correctly excludes products not matching the shopper's criteria means fewer irrelevant products to click through, so lower view rate doesn't always signal a problem.
Add-to-cart rate — the percentage of sessions that resulted in at least one product being added to the cart. Measures commercial intent conversion.
Purchase rate — the percentage of sessions that resulted in a completed purchase. The end-to-end conversion metric for search.
Revenue — total revenue attributed to search sessions in the selected period. Alongside purchase rate, this is the primary business impact metric.
Revenue rate — average revenue per search. Useful for comparing periods with different search volumes — a smaller number of higher-intent searches might generate more revenue per search than a period of high-volume, low-intent browsing.
Trend score — a measure of how rapidly a query or category is gaining momentum relative to its recent baseline, across a choice of metrics (such as search count, view rate, or purchase rate). High trend scores flag emerging intent before it appears in standard volume rankings.
Zero-result rate is a critical signal to monitor, but it should not be treated as the sole measure of search quality. A system may maintain a low zero-result rate while still returning irrelevant or low-quality results. Business metrics such as purchase rate and revenue rate should also be considered, as they reflect how often users successfully complete purchases after searching. However, these metrics cannot serve as absolute indicators of search quality either, since they are heavily influenced by external factors such as pricing, promotions, seasonality, and merchandising changes. In practice, search quality must be evaluated through a combination of metrics, interpreted within the broader business context. A zero-result rate above 1–2% generally warrants immediate investigation.
How it works
Metrics are organized into four views, each answering a different question.
Search performance over time
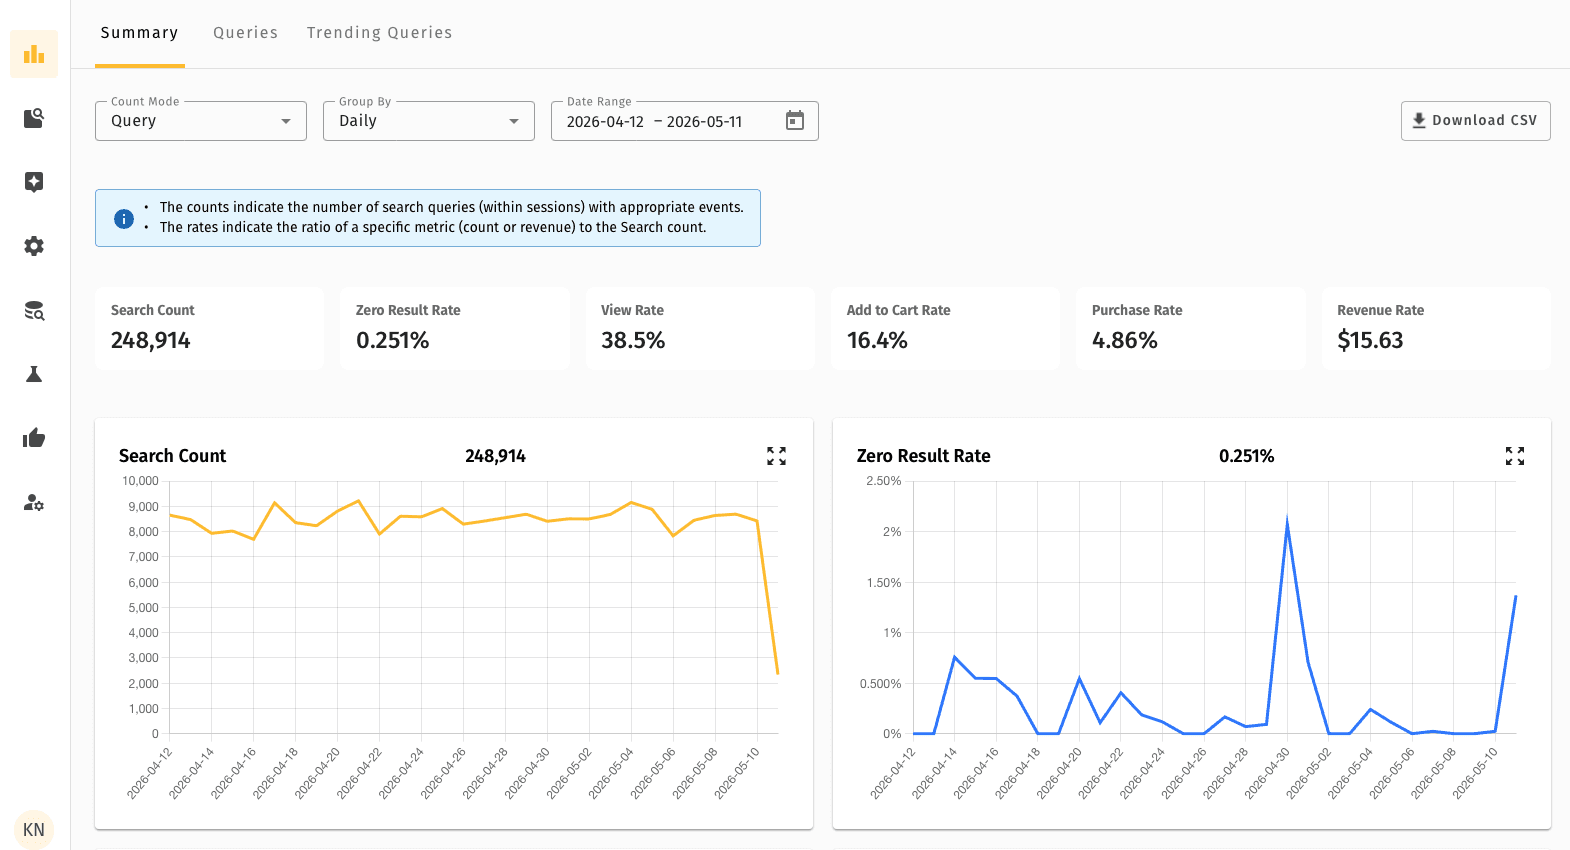
Tracks the full conversion funnel — search volume, zero-result rate, view rate, add-to-cart rate, purchase rate, and revenue — across a configurable date range.
Use this view to:
- Monitor day-over-day search health
- Spot anomalies (sudden zero-result spikes, conversion drops) and correlate them with catalog or configuration changes
- Compare performance across different time periods
Query performance
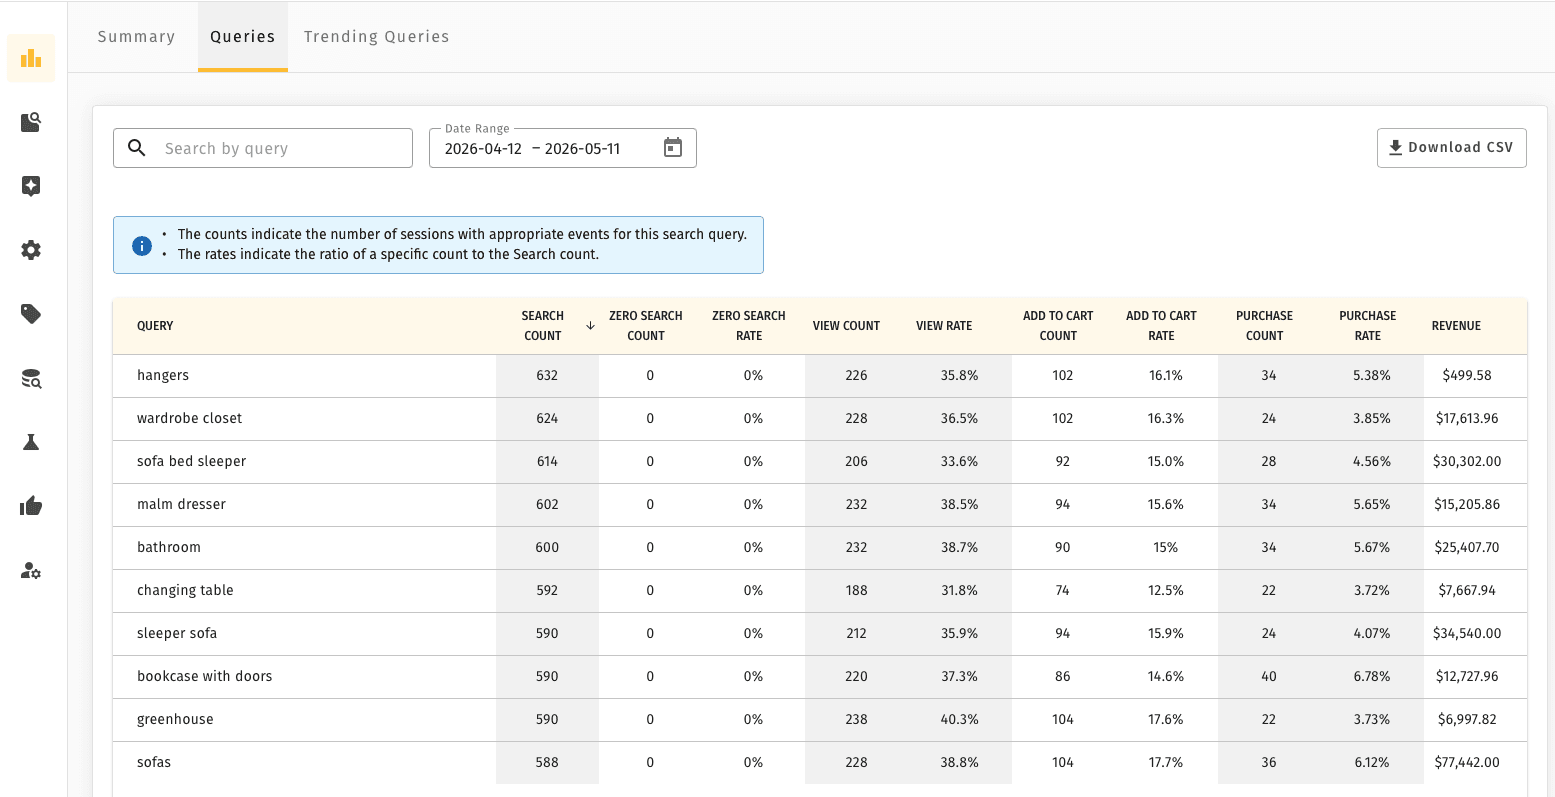
Shows per-query breakdowns of the full conversion funnel: how many times each query was searched, its zero-result rate, view rate, add-to-cart rate, purchase rate, and revenue generated.
Use this view to:
- Find high-traffic queries with poor conversion (high search count, low view rate) — candidates for merchandising rules or linguistic override fixes
- Identify zero-result queries — these need either enrichment or linguistic overrides to map the query to terms the catalog uses
- Find high-converting queries to understand what "good" looks like for your catalog
Product performance
Shows per-product metrics: how often each product appears in search results, how often it's viewed, added to cart, purchased, and how much revenue it drives.
Use this view to:
- Identify high-revenue products and verify they're appearing prominently in relevant searches
- Find products with high view counts but low purchase rates — these may have pricing, content, or attribute quality issues
- Find products with high search counts but low view rates — these may be ranked too low for their relevant queries
Trending queries and categories
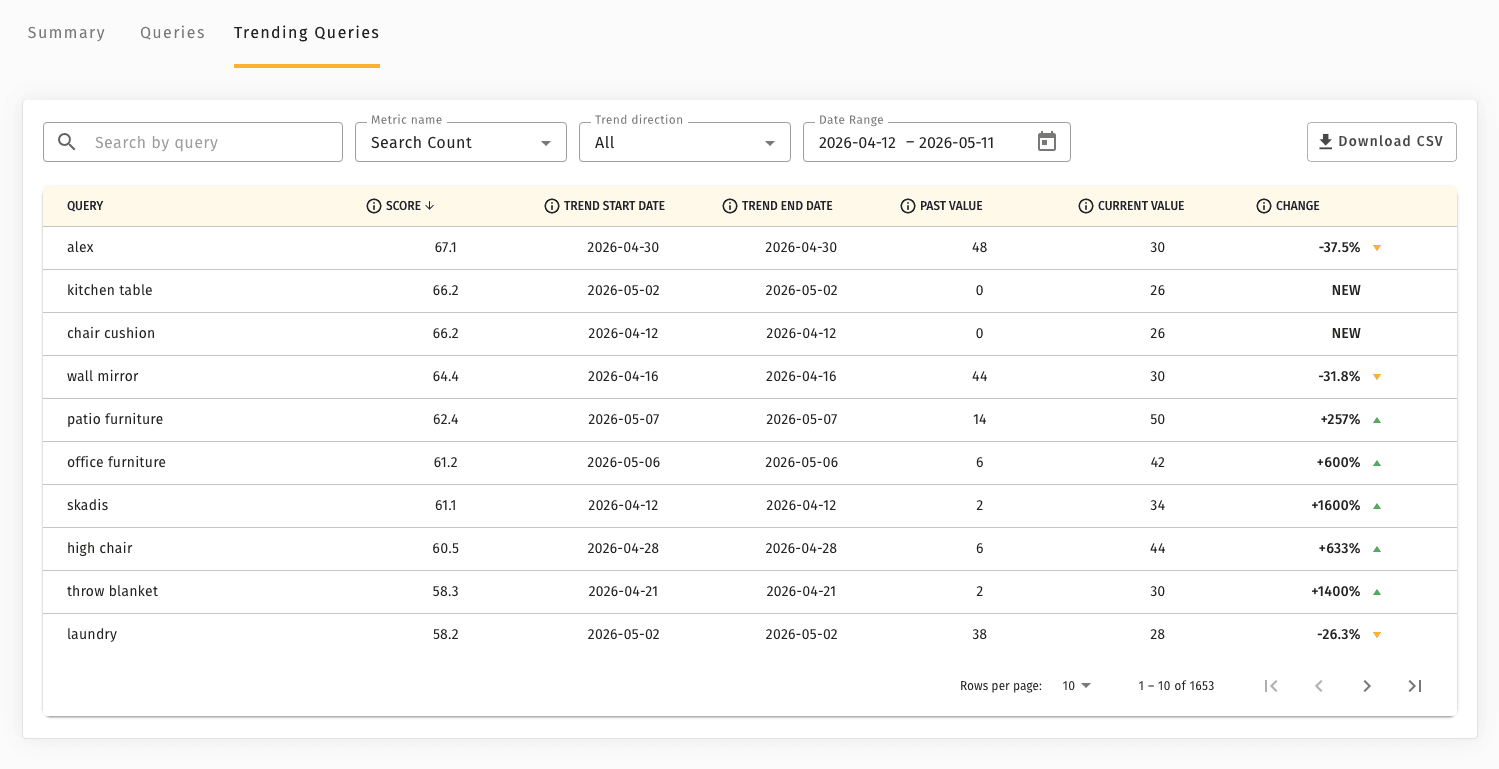
Shows which search queries and product categories are gaining momentum — ranked by trend score, with the change in volume compared to the recent baseline.
Use this view to:
- Spot emerging demand before it peaks — a query trending upward is an opportunity to ensure the catalog can serve it well
- Identify trending categories where inventory or merchandising attention is needed
- Inform enrichment priorities — if a trending category has low attribute coverage, run enrichment on it before demand peaks
All four views support CSV export. Use the download option to pull raw data for any view and run custom analysis beyond what the MXP UI currently supports — cross-view comparisons, custom aggregations, or integration with external reporting tools.
Integration with Evaluation and Merchandising
Metrics are also surfaced inline in two other parts of MXP:
- Evaluation page — when previewing results for a specific query, you can see query-level and product-level business metrics alongside the matched products. This lets you assess search quality and business impact in the same view, without switching to the Metrics tab.
- Merchandising rules — when creating or editing a merchandising rule, the same metrics appear in the query results preview, so you can evaluate the business impact of a rule before publishing it.
Quick example
A search operator opens Metrics on a Monday morning and notices the zero-result rate spiked to 0.9% on Saturday — up from a near-zero baseline all week. They switch to the Query Performance view and filter by zero-result rate descending. Three queries account for the spike, all variations of a product name announced in a press release that weekend.
The products exist in the catalog under a different name than what shoppers are searching for. The operator adds a synonym rule in Linguistic Overrides mapping the new name to the catalog term. By Monday afternoon, the zero-result rate is back to baseline and the three queries are now converting.
Metrics is fully available in Lightweight mode. Every dashboard, the date range selector, time period grouping, count modes, the chart and list views, sorting and pagination, and CSV export all behave exactly as described above. No Metrics feature is removed. Experiment Metrics is a separate feature and is not available in Lightweight mode.
Related pages
- Discovery Rules — act on query performance insights by boosting, burying, or pinning products
- Linguistic Override — fix zero-result queries caused by vocabulary mismatches
- Attribute Enrichment — improve attribute coverage to serve trending categories and reduce zero results
- Evaluation — deeper search quality assessment beyond conversion metrics